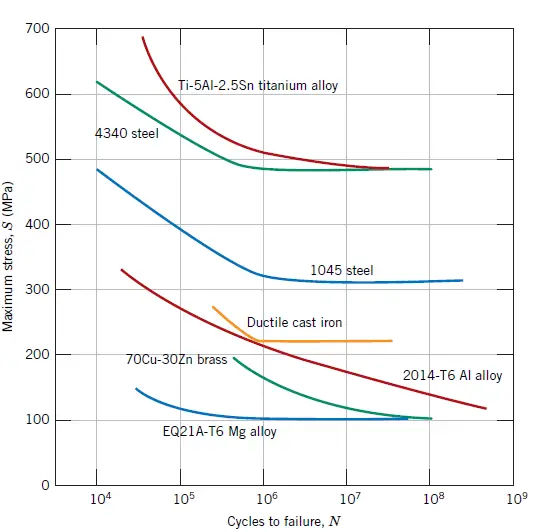
The American Society for Testing and Materials defines fatigue life, Nf, as the number of stress cycles of a specified character that a specimen sustains before failure of a specified nature occurs. Fatigue life is affected by cyclic stresses, residual stresses, material properties, internal defects, grain size, temperature, design geometry, surface quality, oxidation, corrosion, etc. For some materials, notably steel and titanium, there is a theoretical value for stress amplitude below which the material will not fail for any number of cycles, called a fatigue limit, endurance limit, or fatigue strength.
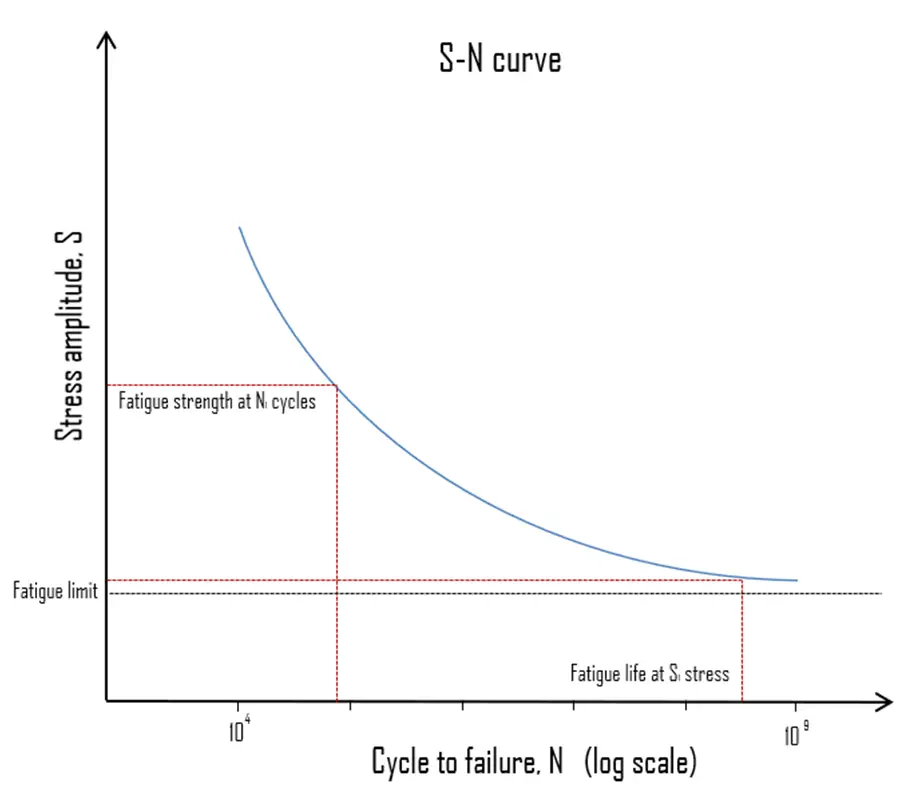
Engineers use a number of methods to determine the fatigue life of a material. One of the most useful is the stress-life method, is commonly characterized by an S-N curve, also known as a Wöhler curve. This method is illustrated in the figure It plots applied stress (S) against component life or number of cycles to failure (N). As the stress decreases from some high value, component life increases slowly at first and then quite rapidly. Because fatigue like brittle fracture has such a variable nature, the data used to plot the curve will be treated statistically. The scatter in results is a consequence of the fatigue sensitivity to a number of test and material parameters that are impossible to control precisely.
The following terms are defined for S-N curve:
- Fatigue Limit. Fatigue limit (also sometimes called the endurance limit) is the stress level, below which fatigue failure does not occur. This limit exists only for some ferrous (iron-base) and titanium alloys, for which the S–N curve becomes horizontal at higher N values. Other structural metals, such as aluminium and copper, do not have a distinct limit and will eventually fail even from small stress amplitudes. Typical values of the limit for steels are 1/2 the ultimate tensile strength, to a maximum of 290 MPa (42 ksi).
- Fatigue Strength. The ASTM defines fatigue strength, SNf, as the value of stress at which failure occurs after some specified number of cycles (e.g., 107 cycles) For example, the fatigue strength for annealed Ti-6Al-4V titanium alloy is about 240 MPa at 107 cycles and the stress concentration factor = 3.3.
- Fatigue Life. Fatigue life characterizes a material’s fatigue behavior. It is the number of cycles to cause failure at a specified stress level, as taken from the S–N plot
The process of fatigue failure is characterized by three distinct steps:
- Crack initiation, in which a small crack forms at some point of high stress concentration.
- Crack propagation, during which this crack advances incrementally with each stress cycle. Most of the fatigue life is generally consumed in the crack growth phase.
- Ultimate failure, which occurs very rapidly once the advancing crack has reached a critical size.
Cracks associated with fatigue failure almost always initiate (or nucleate) on the surface of a component at some point of stress concentration. Anything which leads to stress concentration, and the development of cracks, will reduce fatigue life. Therefore, increasing the degree of surface finish, polishing as compared to grinding, improves fatigue life. Increasing the strength and hardness of the surface layers of metal components will also improve fatigue life.

We hope, this article, Fatigue Limit – Fatigue Strength, helps you. If so, give us a like in the sidebar. Main purpose of this website is to help the public to learn some interesting and important information about materials and their properties.