——
N/A
——
N/A
——
2 MPa
——
7 MPa
——
500 MPa
——
14 MPa
——
4000 MPa
——
30 MPa
——
27 MPa
——
N/A
——
2.8 MPa
——
29 MPa
——
370 MPa
——
N/A
——
130000 MPa
——
150 MPa
——
60 MPa
——
N/A
——
N/A
——
2.5 MPa
——
280 MPa
——
450 MPa
——
514 MPa
——
515 MPa
——
400-550 MPa
——
295 MPa
——
800 MPa
——
1200 MPa
——
250 MPa
——
275 MPa
——
268 MPa
——
2100 MPa (compressive)
——
N/A
——
48 MPa
——
48 MPa
——
N/A
——
2 MPa
——
4.8 MPa
——
293 MPa
——
290 MPa
——
514 MPa
——
760 MPa
——
685 MPa
——
350 MPa
——
1100 MPa
——
600 MPa
——
315 MPa
——
550 MPa
——
56 MPa (19°C)
——
1.65 MPa
——
3600 MPa
——
40 MPa
——
5 MPa
——
N/A
——
0.02 MPa
——
48 MPa
——
1170 MPa
——
640 MPa
——
700 MPa
——
620 MPa
——
1860 MPa
——
414 MPa (>60 ksi)
——
2100 MPa
——
1200 MPa
——
310 MPa
——
1110 MPa
——
70 MPa
——
N/A
——
0.9 MPa
——
20 MPa
——
1.2 MPa
——
N/A
——
0.02 MPa
——
0.08 MPa
——
550 MPa
——
300 MPa
——
350 MPa
——
1000 MPa
——
1200 MPa
——
580 MPa
——
980 MPa
——
445 MPa
——
420 MPa
——
400 MPa
——
N/A
——
70 MPa
——
35 MPa
——
N/A
——
N/A
——
N/A
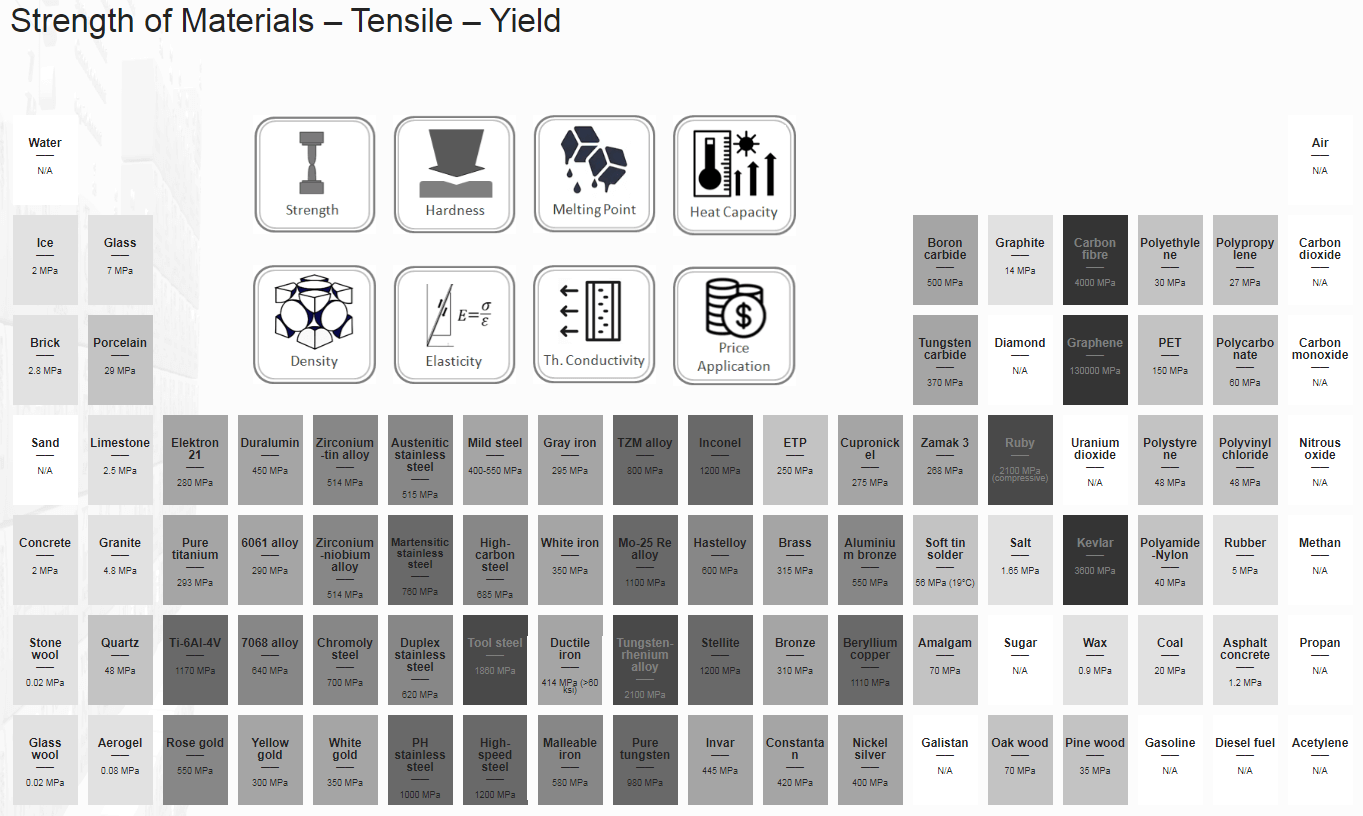
Strength of Materials
 Strength of materials basically considers the relationship between the external loads applied to a material and the resulting deformation or change in material dimensions. In designing structures and machines, it is important to consider these factors, in order that the material selected will have adequate strength to resist applied loads or forces and retain its original shape. Strength of a material is its ability to withstand this applied load without failure or plastic deformation.
However, we must note that the load which will deform a small component, will be less than the load to deform a larger component of the same material. Therefore, the load (force) is not a suitable term to describe strength. Instead, we can use the force (load) per unit of area (σ = F/A), called stress, which is constant (until deformation occurs) for a given material regardless of size of the component part. In this concept, strain is also very important variable, since it defines the deformation of an object. In summary, the mechanical behavior of solids is usually defined by constitutive stress-strain relations. A deformation is called elastic deformation, if the stress is a linear function of strain. In other words, stress and strain follows Hooke’s law. Beyond the linear region, stress and strain show nonlinear behavior. This inelastic behavior is called plastic deformation.
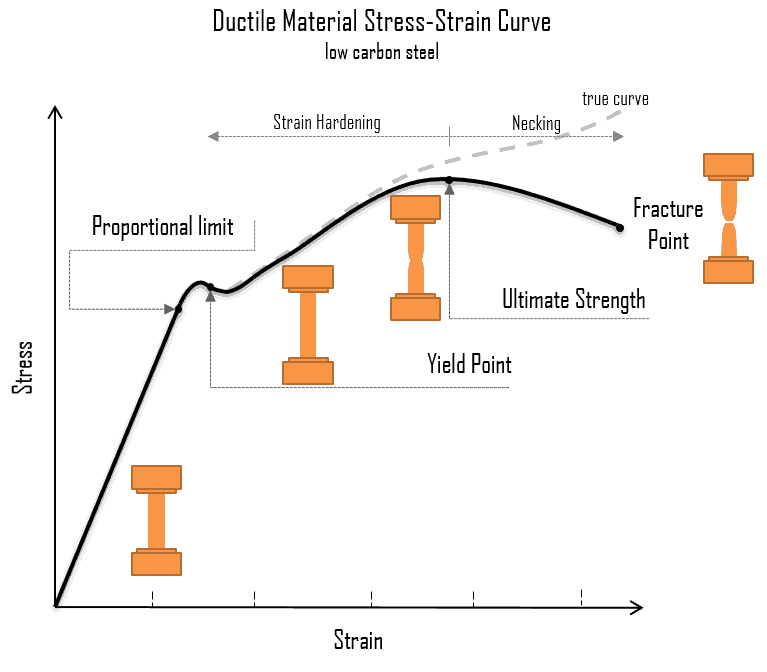
A schematic diagram for the stress-strain curve of low carbon steel at room temperature is shown in the figure. There are several stages showing different behaviors, which suggests different mechanical properties. To clarify, materials can miss one or more stages shown in the figure, or have totally different stages. In this case we have to distinguish between stress-strain characteristics of ductile and brittle materials. The following points describe the different regions of the stress-strain curve and the importance of several specific locations.
- Proportional limit. The proportional limit corresponds to the location of stress at the end of the linear region, so the stress-strain graph is a straight line, and the gradient will be equal to the elastic modulus of the material. For tensile and compressive stress, the slope of the portion of the curve where stress is proportional to strain is referred to as Young’s modulus and Hooke’s Law applies. Between the proportional limit and the yield point the Hooke’s Law becomes questionable between and strain increases more rapidly.
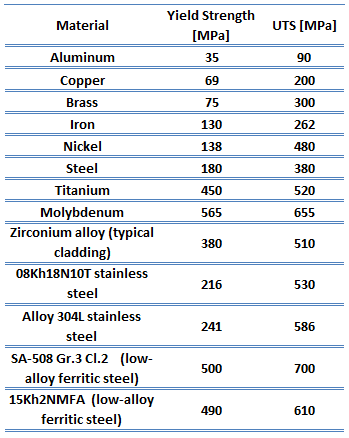 Yield point. The yield point is the point on a stress-strain curve that indicates the limit of elastic behavior and the beginning plastic behavior. Yield strength or yield stress is the material property defined as the stress at which a material begins to deform plastically whereas yield point is the point where nonlinear (elastic + plastic) deformation begins. Prior to the yield point, the material will deform elastically and will return to its original shape when the applied stress is removed. Once the yield point is passed, some fraction of the deformation will be permanent and non-reversible. Some steels and other materials exhibit a behaviour termed a yield point phenomenon. Yield strengths vary from 35 MPa for a low-strength aluminum to greater than 1400 MPa for very high-strength steels.
- Ultimate tensile strength. The ultimate tensile strength is the maximum on the engineering stress-strain curve. This corresponds to the maximum stress that can be sustained by a structure in tension. Ultimate tensile strength is often shortened to “tensile strength” or even to “the ultimate.” If this stress is applied and maintained, fracture will result. Often, this value is significantly more than the yield stress (as much as 50 to 60 percent more than the yield for some types of metals). When a ductile material reaches its ultimate strength, it experiences necking where the cross-sectional area reduces locally. The stress-strain curve contains no higher stress than the ultimate strength. Even though deformations can continue to increase, the stress usually decreases after the ultimate strength has been achieved. It is an intensive property; therefore its value does not depend on the size of the test specimen. However, it is dependent on other factors, such as the preparation of the specimen, the presence or otherwise of surface defects, and the temperature of the test environment and material. Ultimate tensile strengths vary from 50 MPa for an aluminum to as high as 3000 MPa for very high-strength steels.
- Fracture point: The fracture point is the point of strain where the material physically separates. At this point, the strain reaches its maximum value and the material actually fractures, even though the corresponding stress may be less than the ultimate strength at this point. Ductile materials have a fracture strength lower than the ultimate tensile strength (UTS), whereas in brittle materials the fracture strength is equivalent to the UTS. If a ductile material reaches its ultimate tensile strength in a load-controlled situation, it will continue to deform, with no additional load application, until it ruptures. However, if the loading is displacement-controlled, the deformation of the material may relieve the load, preventing rupture.
In many situations, the yield strength is used to identify the allowable stress to which a material can be subjected. For components that have to withstand high pressures, such as those used in pressurized water reactors (PWRs), this criterion is not adequate. To cover these situations, the maximum shear stress theory of failure has been incorporated into the ASME (The American Society of Mechanical Engineers) Boiler and Pressure Vessel Code, Section III, Rules for Construction of Nuclear Pressure Vessels. This theory states that failure of a piping component occurs when the maximum shear stress exceeds the shear stress at the yield point in a tensile test.